Why head-to-head records and surface context are the backbone of value betting in tennis
You already know that tennis isn’t random: styles, surfaces and matchups create recurring patterns you can exploit. Value betting means backing odds that are mispriced relative to the true probability of an outcome. To get there, you’ll need to move beyond raw rankings and public sentiment and anchor your assessment in head-to-head history and surface-specific behaviour. Head-to-head (H2H) can reveal stylistic edges — for example, a big server who struggles against a low-bouncing counterpuncher — that don’t show up in simple Elo or ranking models.
When you approach a match, ask yourself: does the matchup favor one player’s strengths on this surface? How recent and relevant is the H2H data? You should weigh matches on different surfaces differently and discount older encounters when players have significantly changed their game or fitness. This combination of matchup nuance and surface context is where many value bets are hiding.
How clay-court dynamics shift probabilities and create specific betting opportunities
Clay is a unique environment: slower conditions, higher bounce, longer points and a premium on movement and patience. That changes how typical metrics translate into match outcomes. A player with superior serve speed might command matches on grass or hard courts, but on clay, serve dominance is reduced and return depth, topspin and endurance matter more. For value betting, that means the implied probability derived from general-season form often overestimates big servers and underestimates grinders on clay.
- Break point conversion and defense: Clay leads to more return games and break chances; players with high break-point conversion or break-saving rates on clay are more valuable than their overall numbers suggest.
- Movement and slide proficiency: Technical footwork and the ability to slide into shots is often a decisive edge; look for players with strong clay-court win rates over a variety of opponents.
- Rally tolerance: Longer points favor players with aerobic capacity and patience; late-match fatigue can flip probabilities in longer formats (best-of-five).
In practice, that means you should adjust your models or manual odds by surface-specific multipliers. For example, downgrade fast-serve impact and upgrade return and rally-stamina metrics when projecting clay outcomes. That recalibration is where brokers’ lines and casual bettors often err, creating value you can exploit.
Early signs to scan before committing a stake
Before you place a bet, quickly check recent clay matches, head-to-heads on the same surface, and any tactical shifts (new coach, heavy topspin addition, injury). Use serve and return splits on clay specifically, not season-wide aggregates. Also consider match format and tournament stage — motivational factors and pressure at Grand Slams or Masters events can amplify surface advantages.
Next, you’ll learn how to read and quantify serve-return statistics and how those metrics differ between ATP and WTA lines to refine probability estimates and build a consistent value-betting approach.
Quantifying serve and return: the metrics that move probabilities
Once you accept that serve and return are the principal levers in tennis outcomes, the next step is translating raw stats into adjustments to implied probabilities. Not all metrics are equally predictive; some map more directly to match-level outcomes than others. The ones you should prioritize are:
- Return games won (RGW): This is one of the cleanest indicators of a player’s ability to create break opportunities. On slower surfaces, a higher RGW correlates strongly with match wins because breaks are more frequent and decisive.
- First-serve win % (1S%): Shows how effective a player is at converting first serves into quick points. It’s a strong predictor of hold probability, particularly on faster surfaces.
- Second-serve win % (2S%): Critical for identifying vulnerability. A low 2S% indicates a player is likely to concede free points on serve, which inflates opponent break chances.
- Break-point conversion/save: These clutch numbers matter in tight matches; high conversion can tilt close sets, while save% on break points shows mental fortitude under pressure.
- Return points won on first/second serve: Finer-grained than RGW, these tell you whether a returner is attacking the serve or merely surviving.
How to use them: convert these percentages into expected service holds and breaks for a match. A simple working method is to estimate each player’s hold probability on the surface (use surface-specific historical hold% or average of 1S% and 2S%-derived hold estimates), then simulate expected breaks per set. From there, run a short binomial or Markov simulation to convert expected holds/breaks into set and match win probabilities. If you don’t want to build a full model, apply surface-weighted multipliers: boost a player’s win probability when their RGW exceeds the opponent’s by a meaningful margin on that surface, and penalize when their 2S% is substantially lower.
Always account for sample size: two matches on clay don’t make a trend. Use rolling windows (last 20–50 matches on surface where possible) and weight recent form higher. For players with thin data, supplement percentages with observable traits — a new increase in topspin, a coaching change, or chronic injury — and discount raw metrics accordingly.
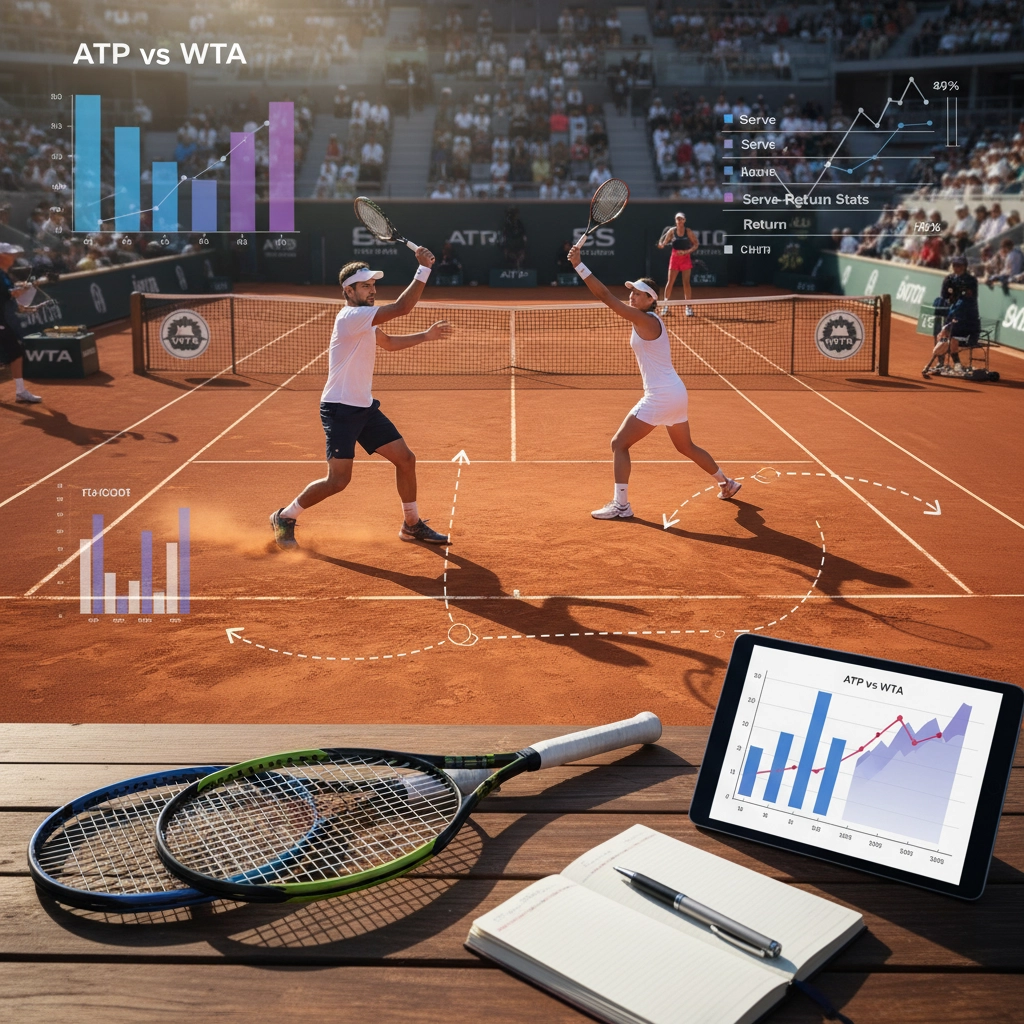
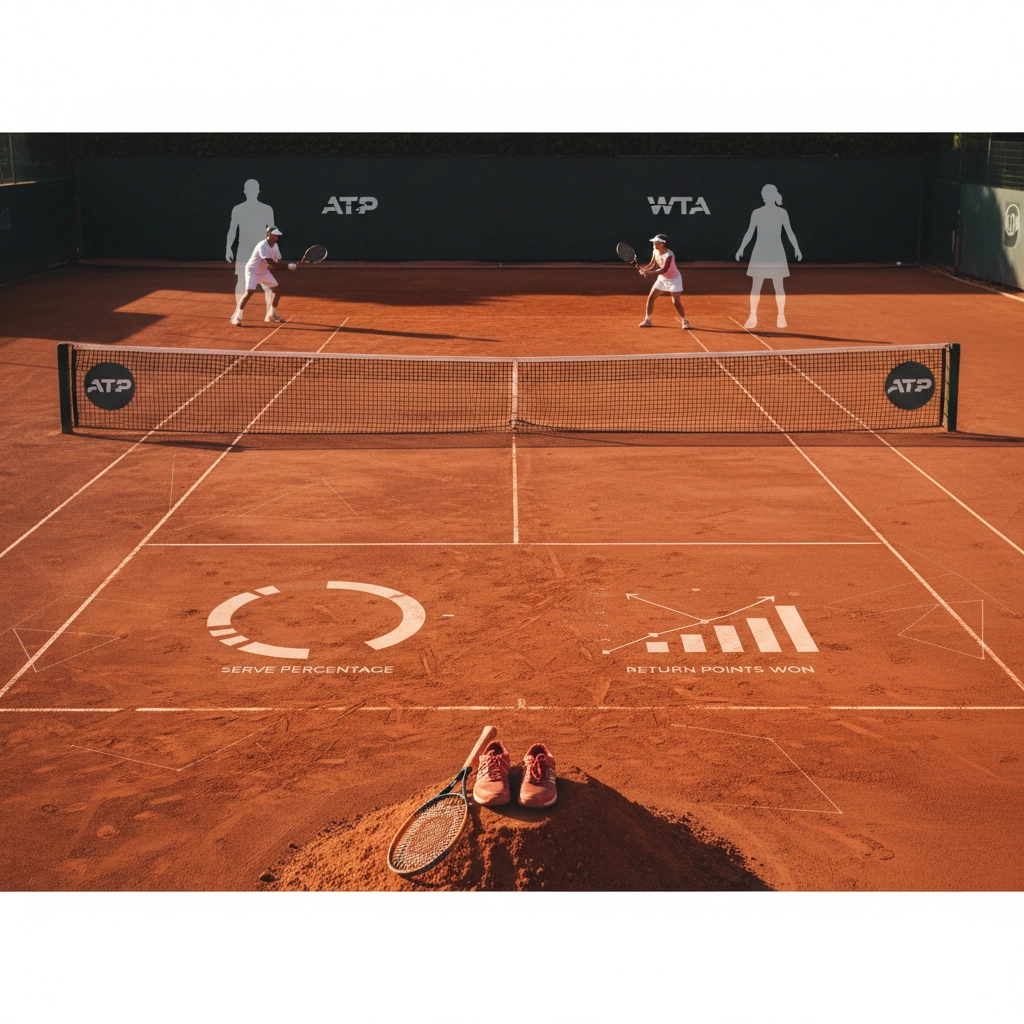
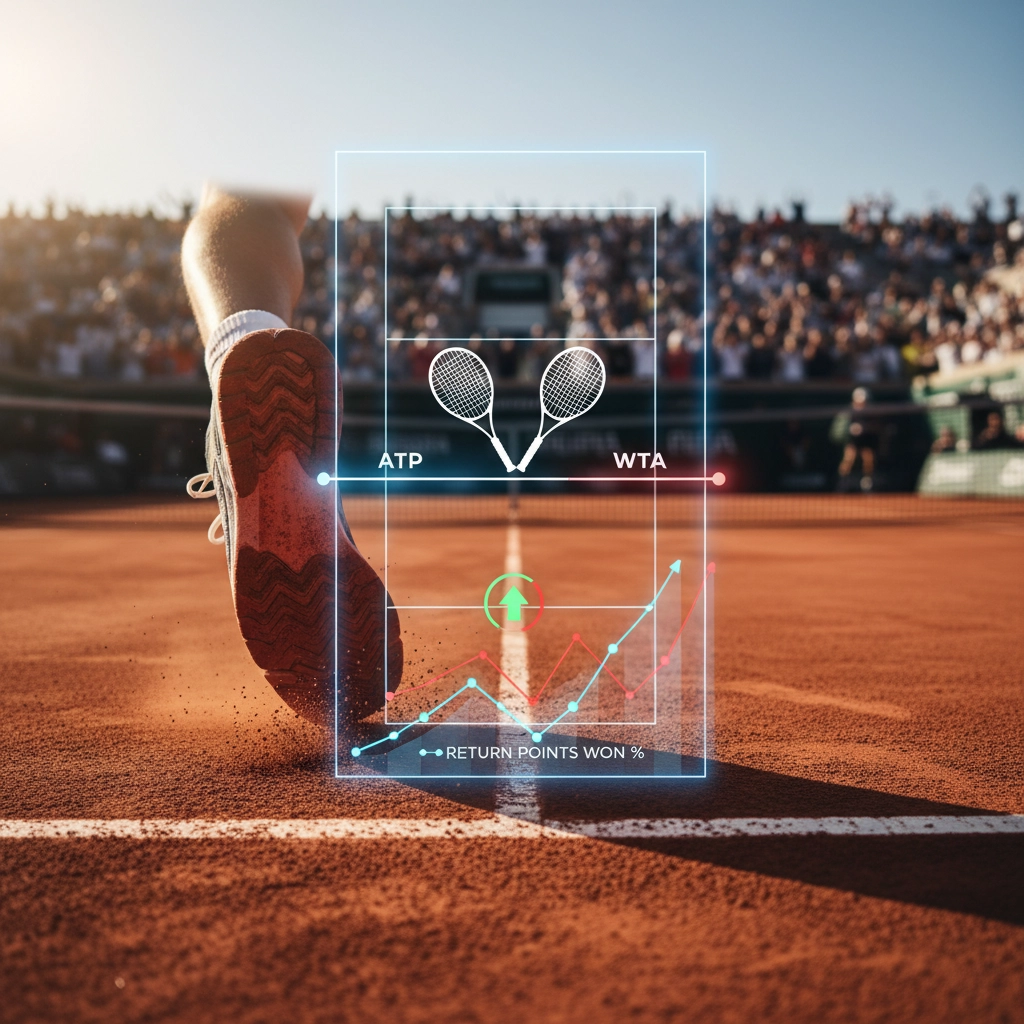
ATP vs WTA: how serve-return distributions change the market and your edge
The serve-return relationship differs between the tours, and that changes where value usually appears. ATP matches feature more aces and free points off the first serve; as a result, big servers can run up quick hold streaks that the market often prices as sustainable. That creates two exploitable angles: fade overpriced servers on clay or against elite returners, and target second-serve liabilities where markets underreact.
On the WTA, rallies on serve are more common and second serves are attacked more consistently, so return-based metrics tend to be intrinsically more predictive of outcomes. A WTA player with a strong RGW or high return points won is often underpriced relative to the ATP equivalent because casual bettors overvalue power and ranking.
Market behavior also diverges: ATP lines move more on serve-speed narratives and headline numbers (aces, service points won), while WTA markets respond more to recent match rhythm and matchup nuance. Use that to your advantage—if public money is pushing a popular ATP big server after a high-ace performance on hard court, check clay or a top returner matchup for mispricing. Conversely, on the WTA tour, dig deeper into return splits and physical continuity; small differences in 2S% or RGW can imply larger shifts in win probability than the market expects.
Finally, in-play markets accentuate these differences. On the ATP tour a slip in first-serve % in a set often creates immediate live value against the server; on the WTA, a few consecutive successful return games can see the price collapse quickly. Monitor serve metrics live and be ready to act when short-term deviations appear sustainable (e.g., a server struggling physically or a returner finding rhythm).
Putting theory into action
Now that you’ve got the frameworks and the metrics, the practical step is intentional application: pick a small set of signals (H2H on surface, RGW, 2S%, recent clay form), create simple rules for when those signals indicate an edge, and test them with a light stake plan. Track every bet and its rationale so you can iterate. Discipline — in staking, model updates and sample-size awareness — converts insight into profit more reliably than intuition alone.
Final thoughts for the value bettor
Successful value betting in tennis is a process, not a one-off. Focus on building a repeatable workflow: gather surface-specific stats, prioritize meaningful serve-return splits, adjust for ATP/WTA differences, and always question market narratives. Protect your bankroll, keep records, and be willing to act against popular sentiment when your model or read shows a genuine edge. For reliable data and deeper splits to support your models, consult dedicated resources like Tennis Abstract.
Frequently Asked Questions
How should I weight head-to-head records versus recent surface form?
Give more weight to H2H when the matches are recent and on the same surface; otherwise, prioritize recent surface-specific form. As a rule of thumb: strong, recent H2H on the same surface = high weight; older H2H or cross-surface meetings = heavily discounted.
What serve-return stats are most reliable for small sample sizes?
Return games won (RGW) and second-serve win % are fairly robust even with limited samples because they reflect consistent tactical ability. Avoid over-interpreting volatile metrics like aces per match in small samples; supplement numbers with video or coach reports when data is thin.
Do I need different strategies for ATP and WTA matches?
Yes. ATP lines tend to overvalue big servers, so look for fades on slower surfaces or against elite returners. WTA outcomes often hinge more on return and rally consistency, so prioritize RGW and second-serve vulnerabilities. Adjust staking and live-play timing to those differences.